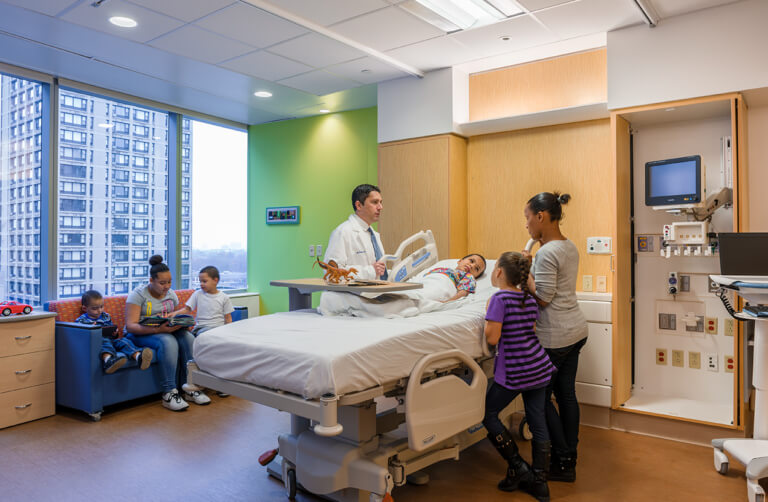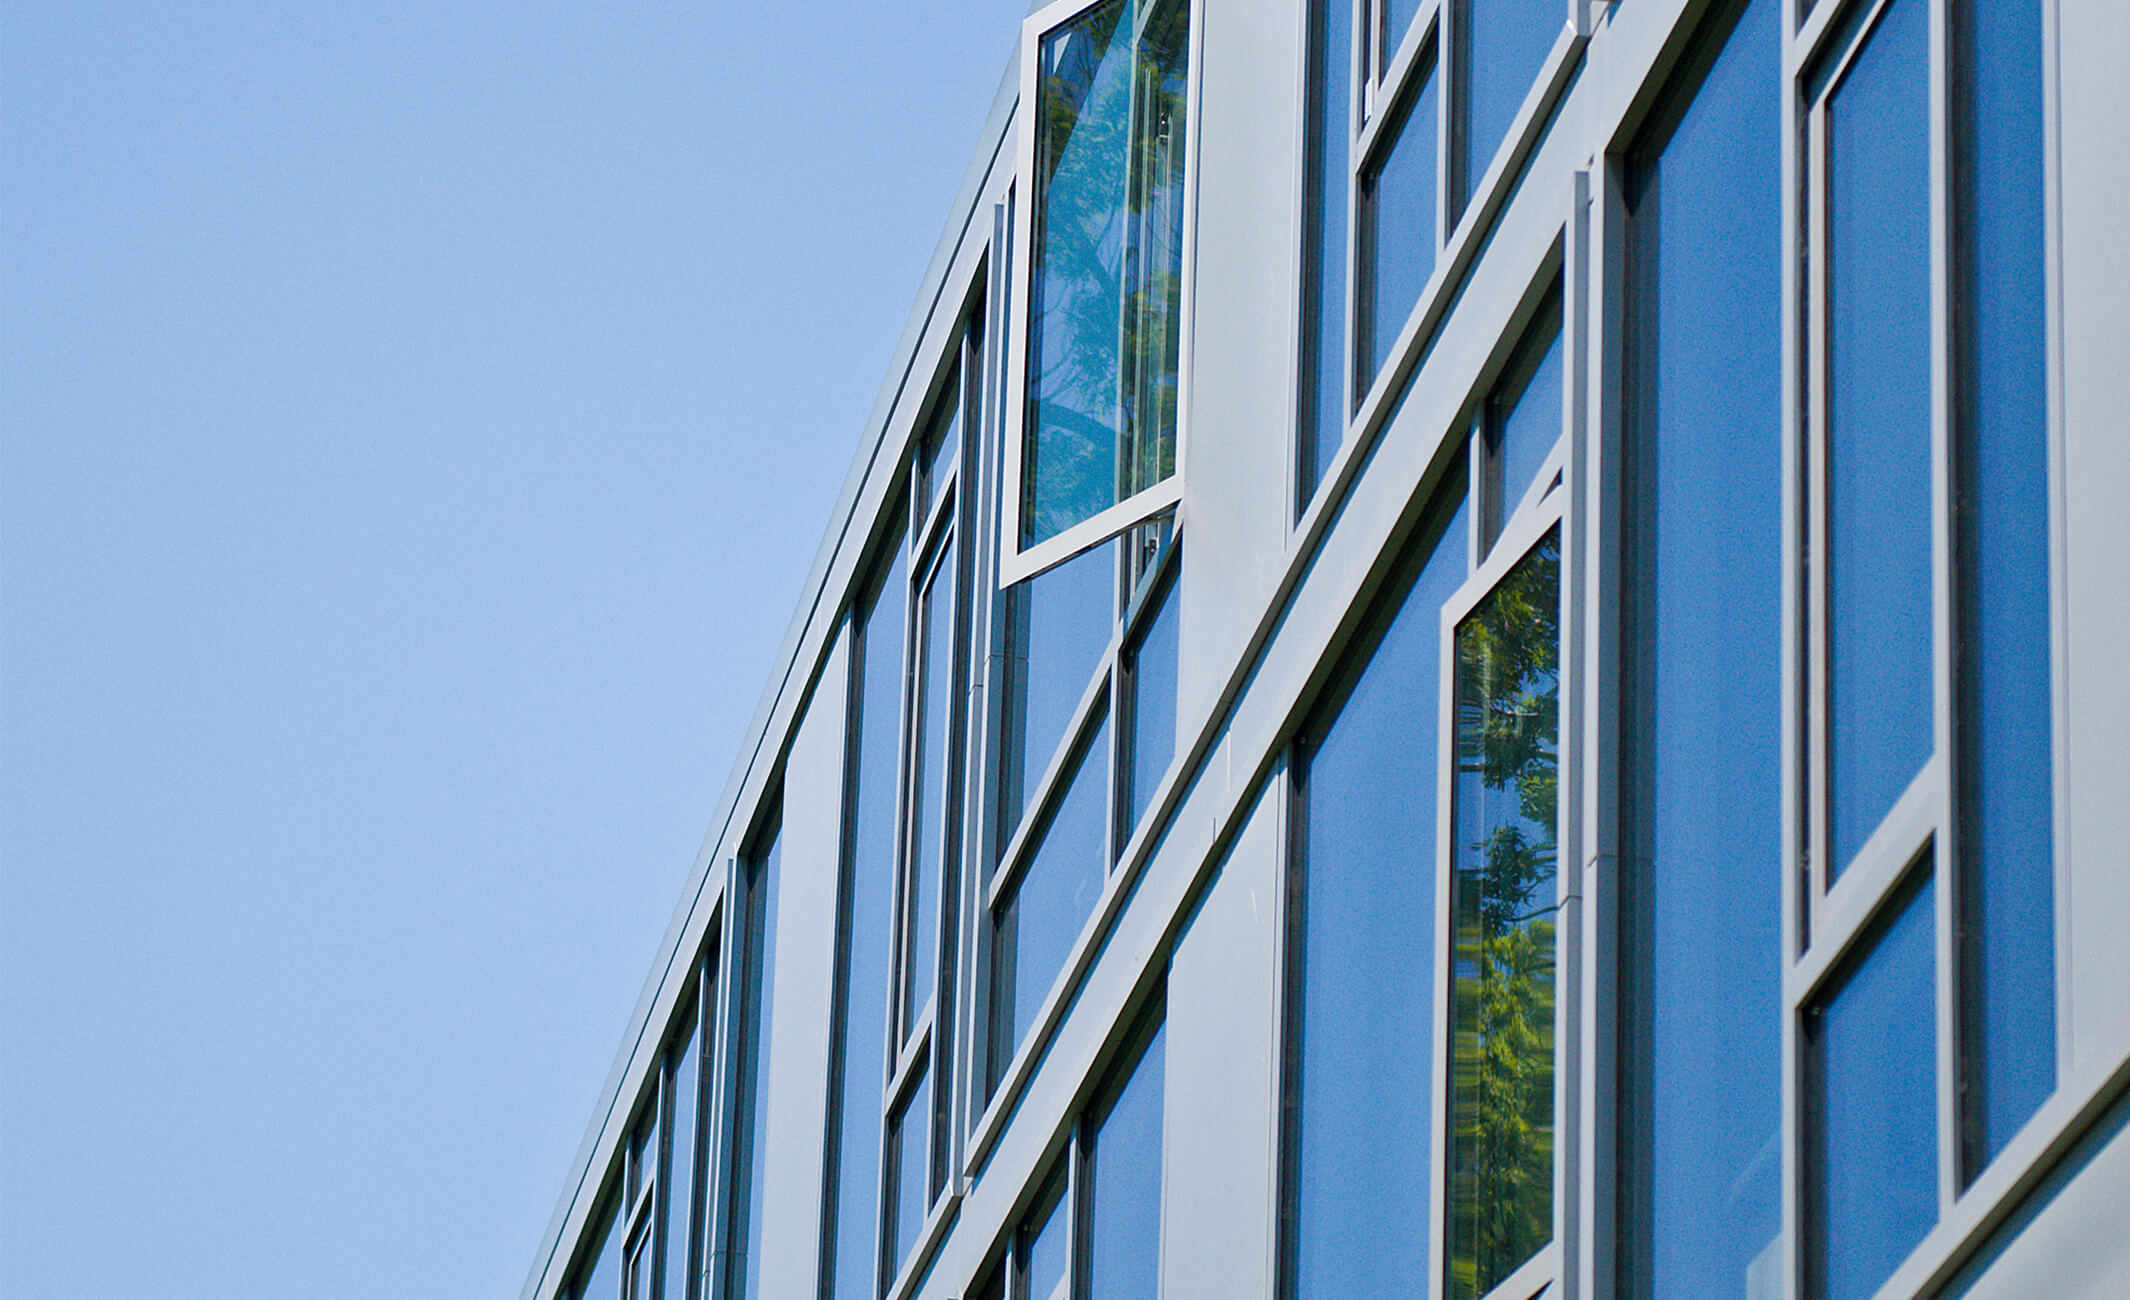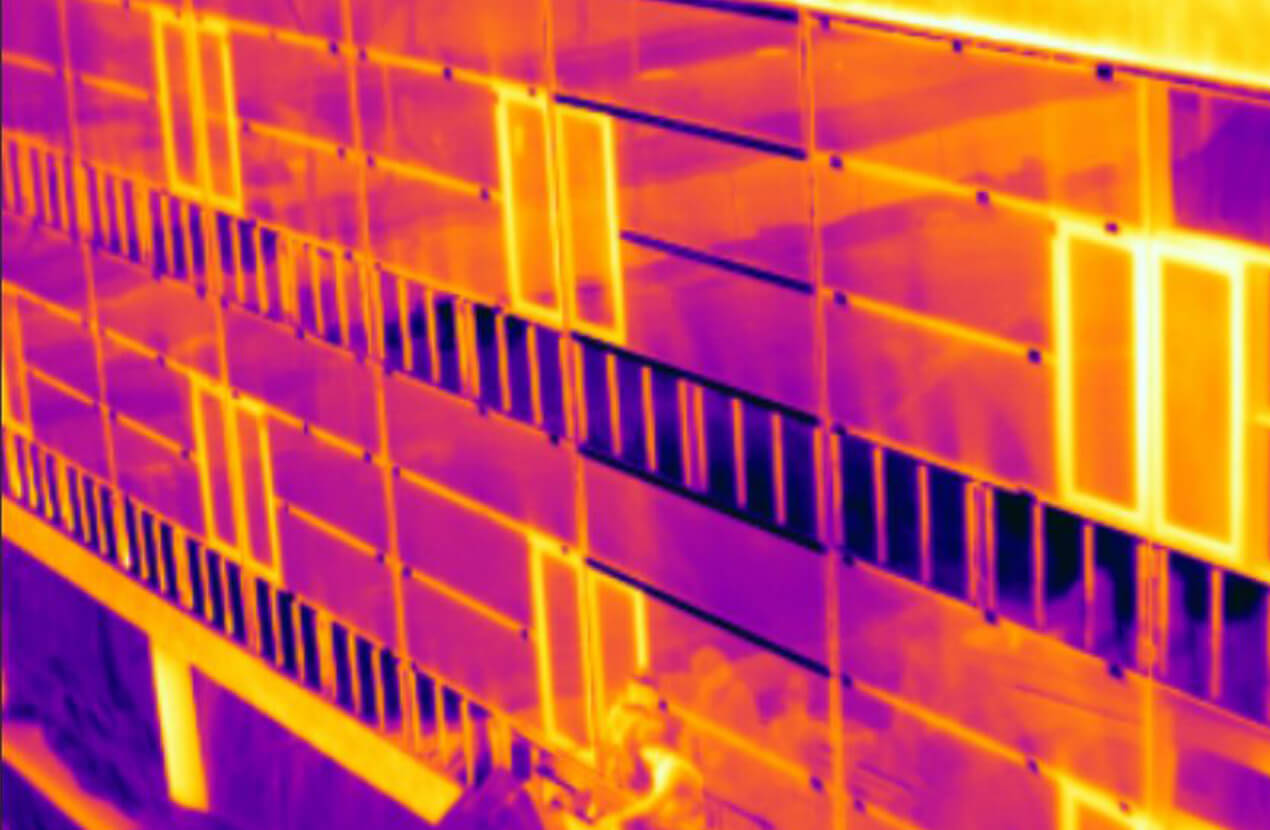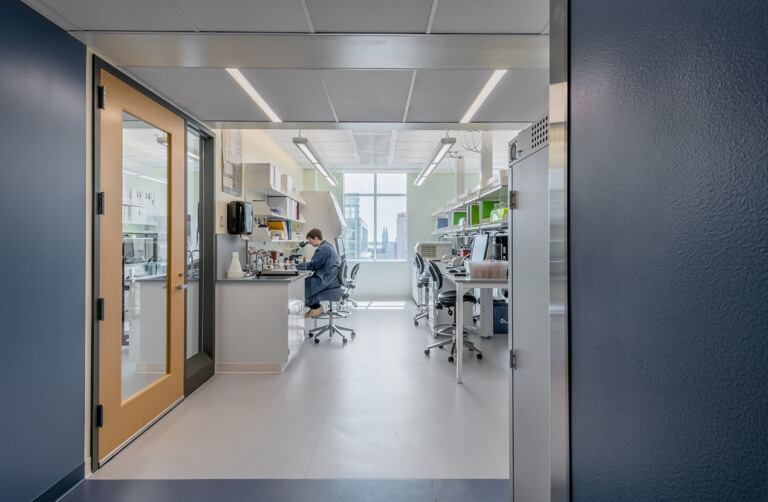
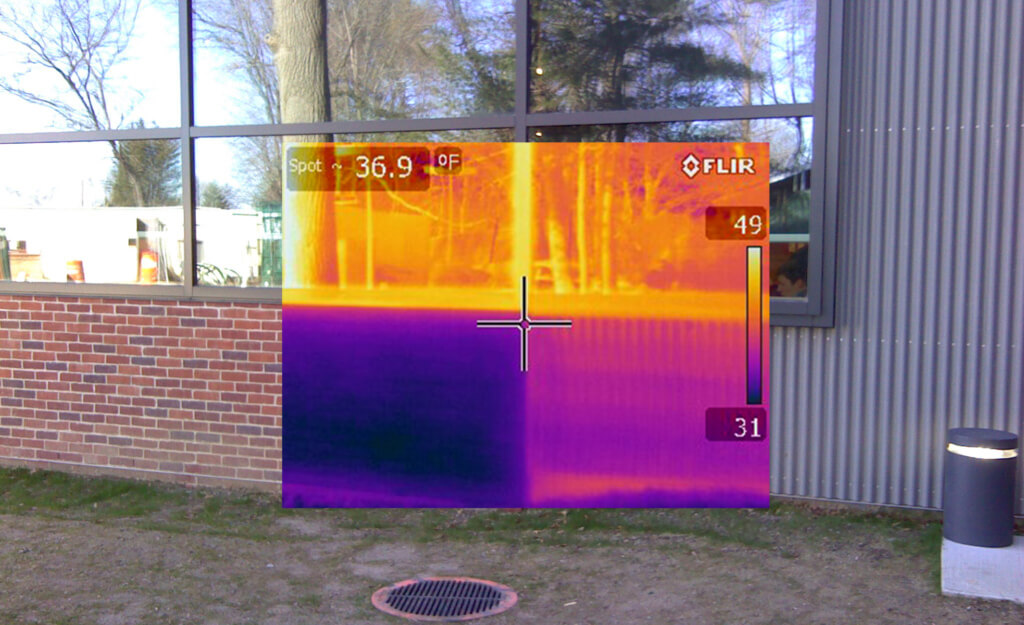
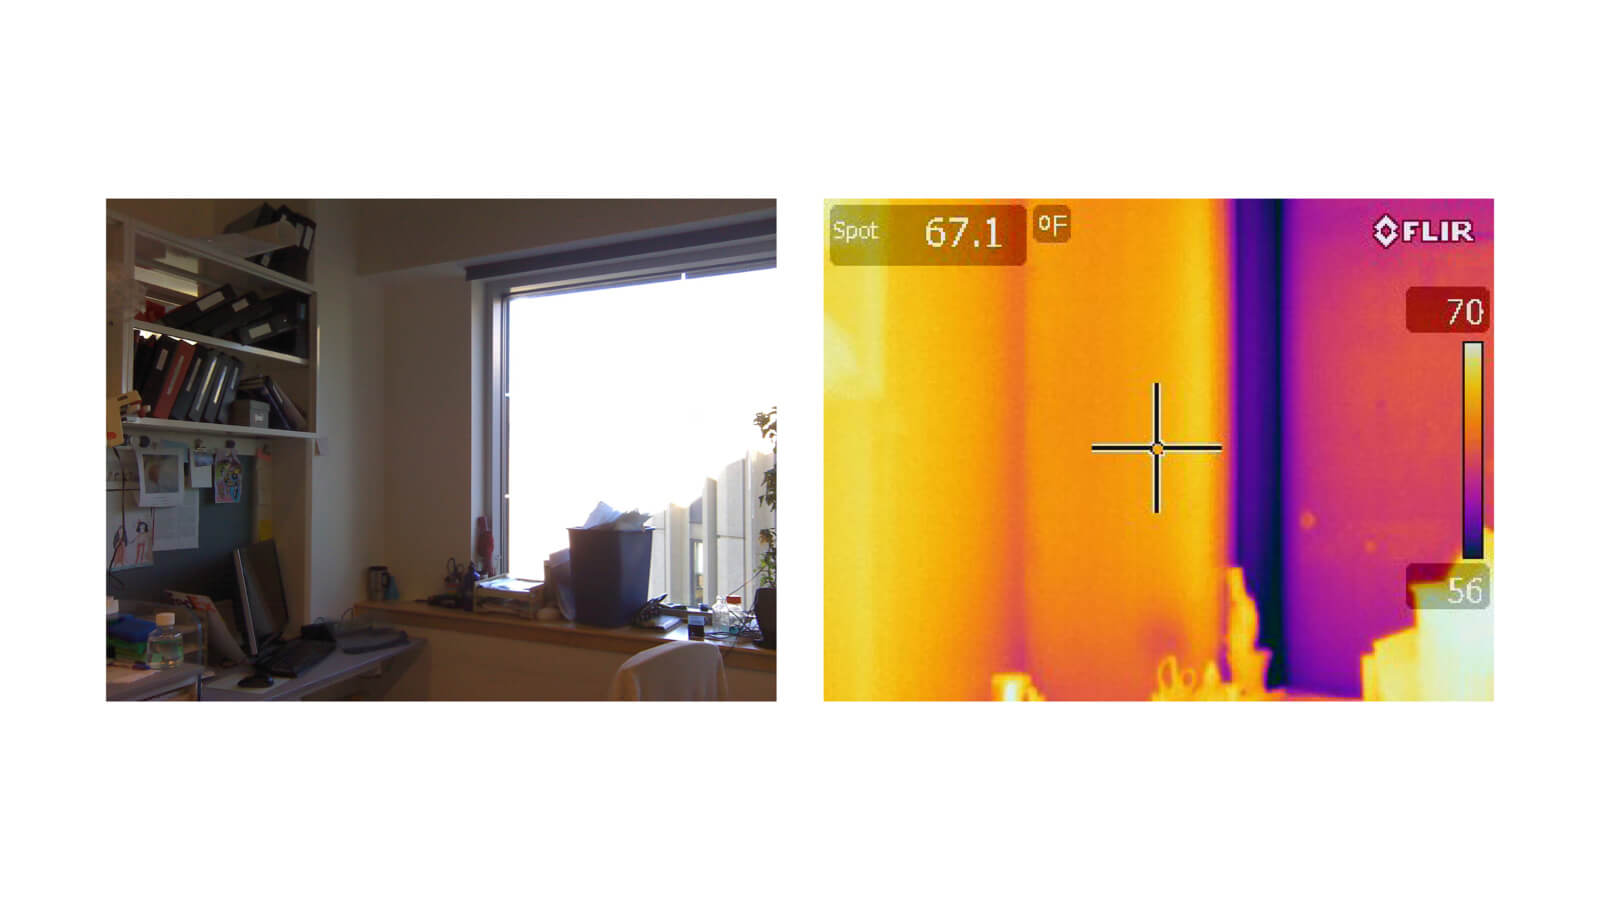
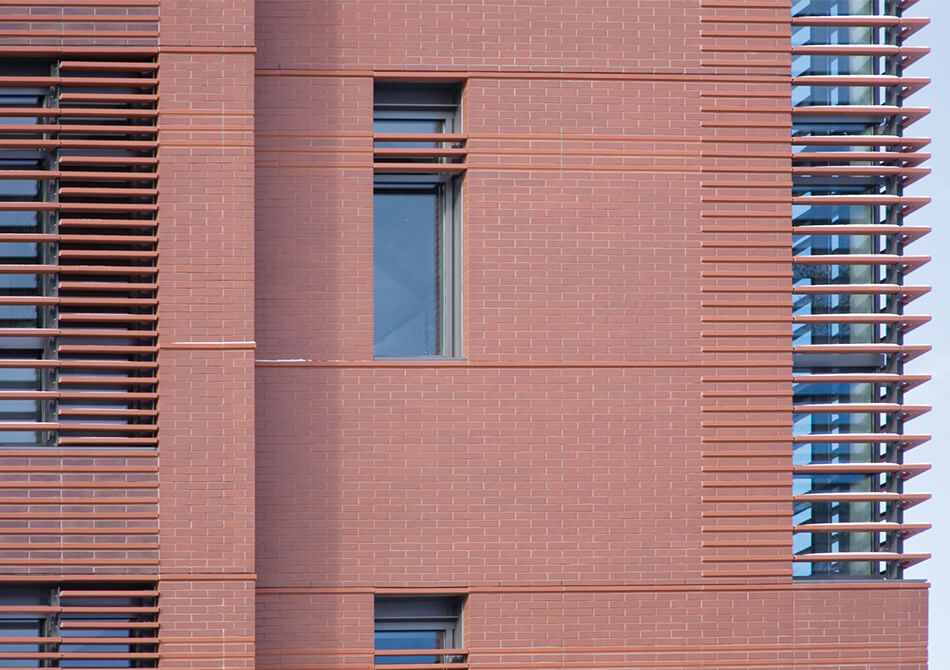
Funded in part through an AIA Upjohn Research Grant, this investigation seeked to quantify the effects of thermal bridging in commercial facades and then propose alternative solutions to improve performance. Utilizing infrared images taken from targeted assemblies at 15 recently completed buildings; we determined the actual performance and R-values of a range of façade types and conditions.
Blog Posts
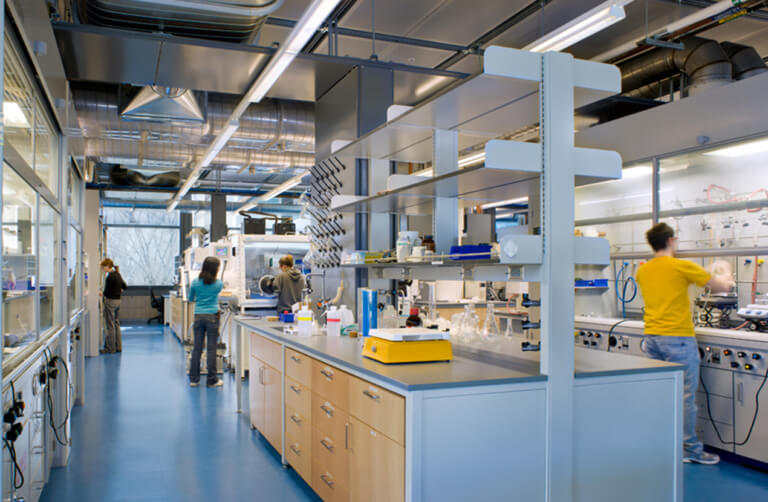
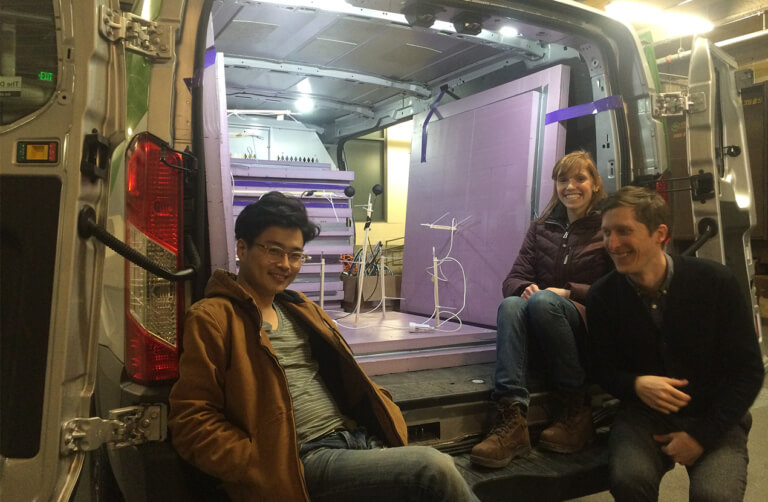
TEAM
Challenge
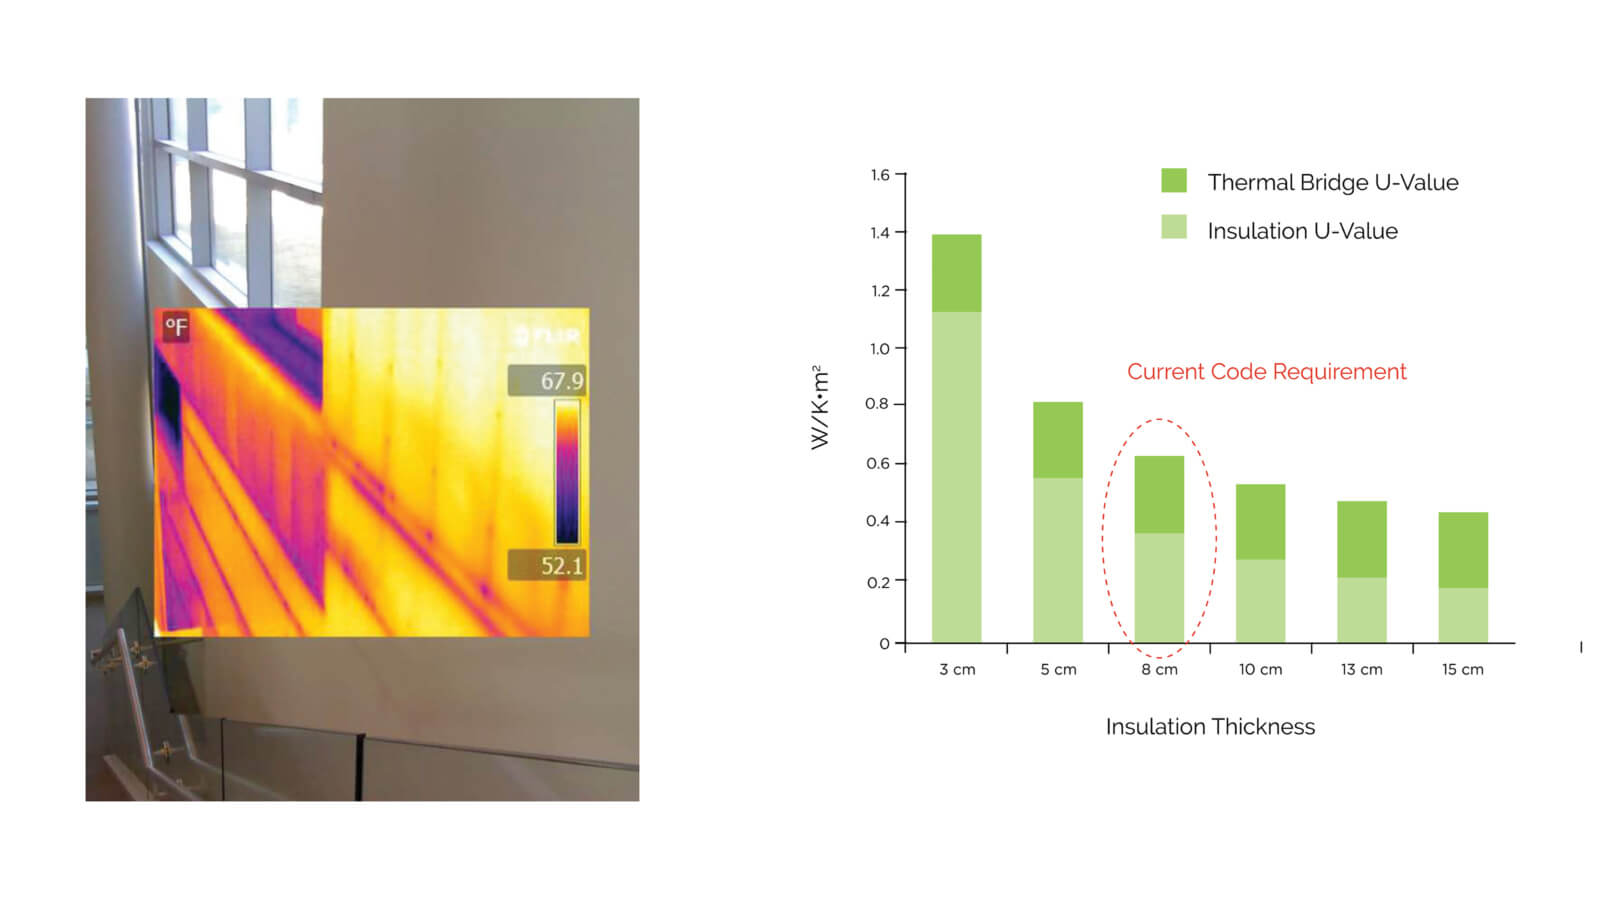
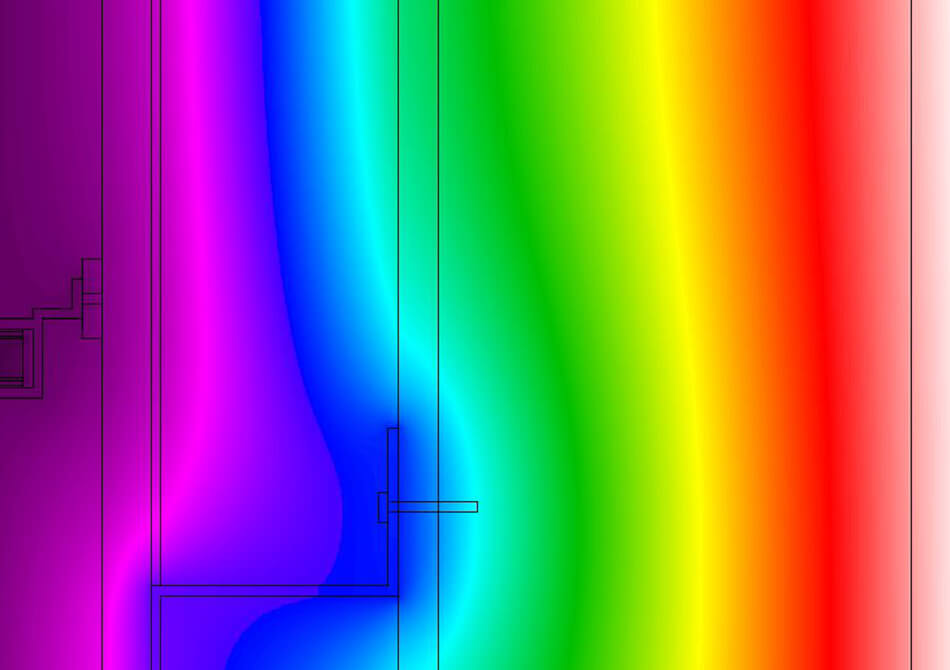
While the occurrence of thermal bridges in commercial wall assemblies is a widely understood phenomenon, only a few research studies have been conducted, but those have shown that thermal bridges can reduce assembly R-values by up to 45% or more.
Solution
The outcome of this research is a better understanding of thermal bridging and the performance of facades. We compared the observed R-values with the design intended R-values in drawings and specifications to quantify the discrepancy between design intentions and actual performance. Based on thousands of images collected, we identified 16 areas of thermal bridging that was commonly observed in the buildings surveyed. Using heat transfer simulations, we developed models that allowed us to arrive at improved detailing of different systems. The study proposes alternatives to industry standards that can provide enhanced thermal performance.